Reshaping and Plotting data
Overview
Teaching: min
Exercises: minQuestions
Objectives
Learning Objectives
- Reshape a tibble
- Start with ggplot2
Our biological question: can we see the behaviour of our favourite genes?
- Plot the individual trajectories of favourites: NOP16, NOP56, ACT1
Reshape/tidy the data
gather(mRNA_data,key=Vol,value="log2_ratio",-Name,-Gene)
# A tibble: 53,704 x 4
   Name  Gene      Vol   log2_ratio
   <chr> <chr>     <chr>      <dbl>
 1 Q0010 <NA>      40 fL      0.145
 2 Q0017 <NA>      40 fL     -1.32
 3 Q0032 <NA>      40 fL     NA
 4 Q0045 COX1      40 fL      0.252
 5 Q0050 AI1       40 fL     -0.784
 6 Q0055 AI2       40 fL     -0.369
 7 Q0060 AI3       40 fL     -0.143
 8 Q0065 AI4       40 fL     -0.377
 9 Q0070 AI5_ALPHA 40 fL     -0.439
10 Q0075 AI5_BETA  40 fL     -0.450
# ... with 53,694 more rows
mRNA_data_gathered <-
gather(mRNA_data,key=Vol,value="log2_ratio",-Name,-Gene) %>%
    separate(Vol,into="Vol_fL") %>%
    mutate(Vol_fL = as.numeric(Vol_fL))
Warning: Expected 1 pieces. Additional pieces discarded in 53704 rows [1,
2, 3, 4, 5, 6, 7, 8, 9, 10, 11, 12, 13, 14, 15, 16, 17, 18, 19, 20, ...].
mRNA_data_gathered
# A tibble: 53,704 x 4
   Name  Gene      Vol_fL log2_ratio
   <chr> <chr>      <dbl>      <dbl>
 1 Q0010 <NA>          40      0.145
 2 Q0017 <NA>          40     -1.32
 3 Q0032 <NA>          40     NA
 4 Q0045 COX1          40      0.252
 5 Q0050 AI1           40     -0.784
 6 Q0055 AI2           40     -0.369
 7 Q0060 AI3           40     -0.143
 8 Q0065 AI4           40     -0.377
 9 Q0070 AI5_ALPHA     40     -0.439
10 Q0075 AI5_BETA      40     -0.450
# ... with 53,694 more rows
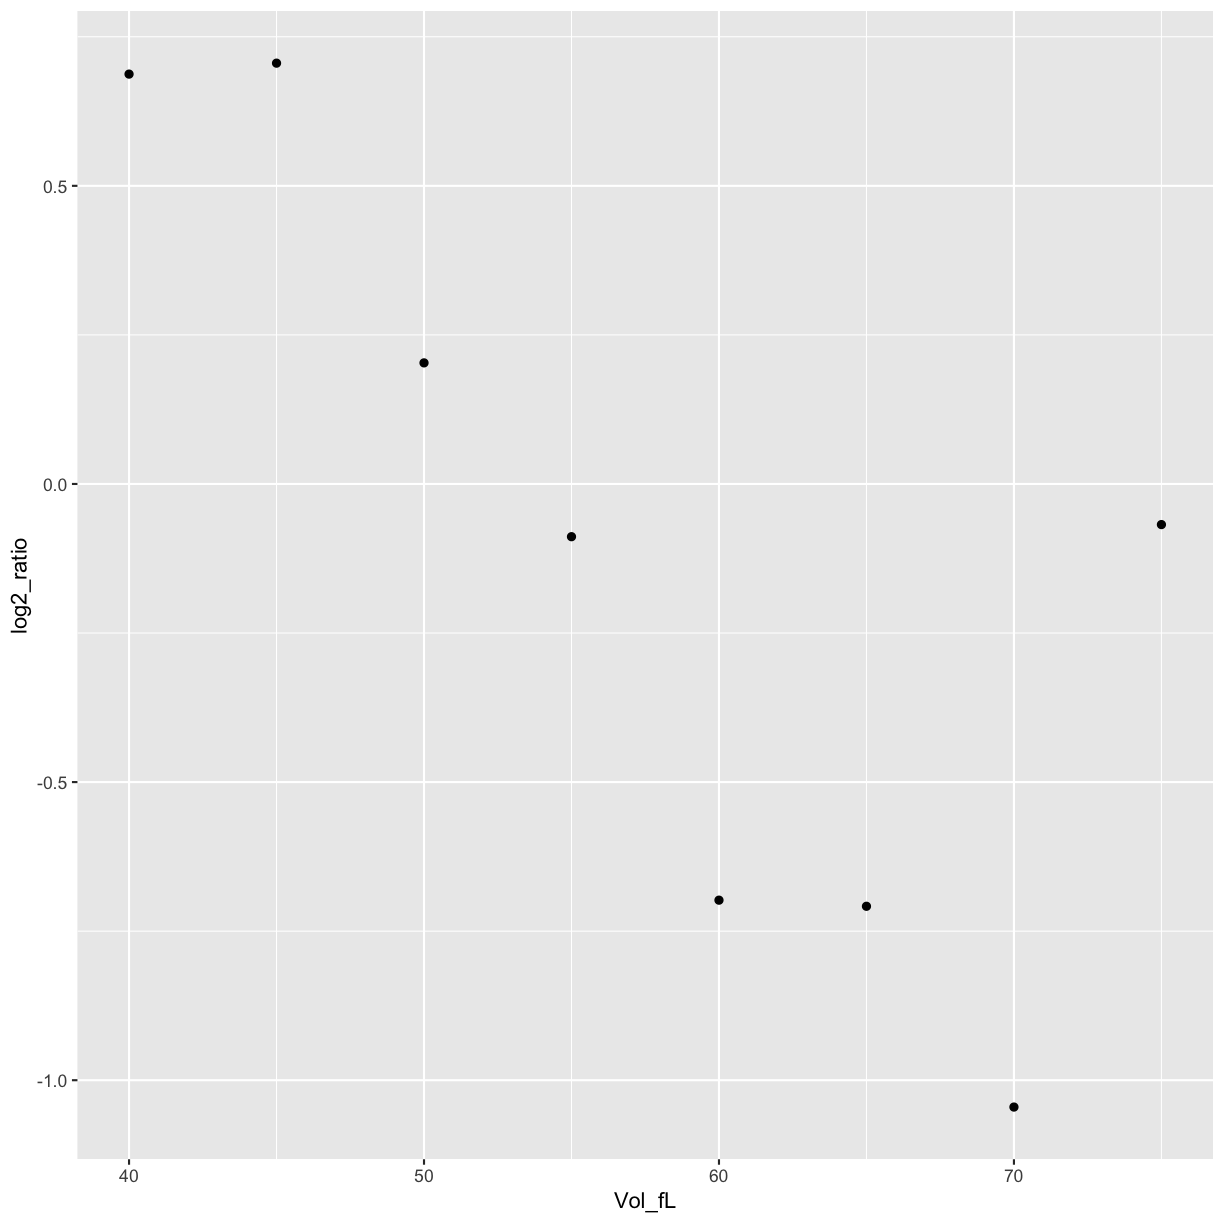
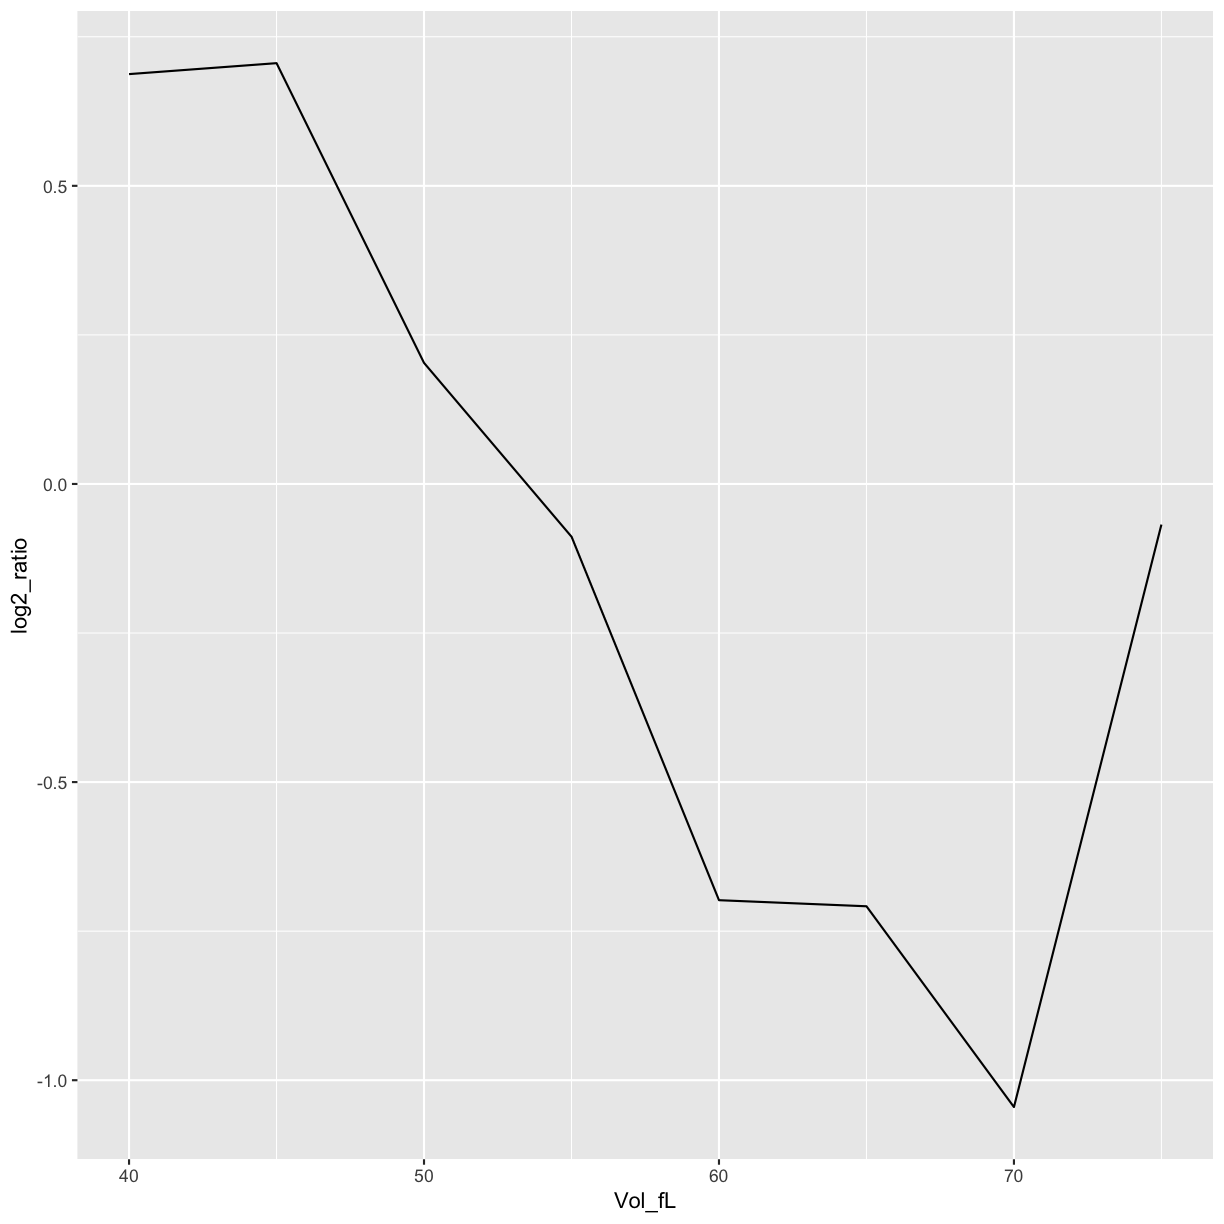
mRNA_data_NOP16 <- filter(mRNA_data_gathered, Gene=="NOP16")
mRNA_data_NOP16
# A tibble: 8 x 4
  Name    Gene  Vol_fL log2_ratio
  <chr>   <chr>  <dbl>      <dbl>
1 YER002W NOP16     40     0.687
2 YER002W NOP16     45     0.706
3 YER002W NOP16     50     0.203
4 YER002W NOP16     55    -0.0884
5 YER002W NOP16     60    -0.698
6 YER002W NOP16     65    -0.708
7 YER002W NOP16     70    -1.05
8 YER002W NOP16     75    -0.0681
Plot NOP16 data
ggplot(data=mRNA_data_NOP16, aes(x=Vol_fL,y=log2_ratio)) +
    geom_point()
ggplot(data=mRNA_data_NOP16, aes(x=Vol_fL,y=log2_ratio)) +
    geom_line()
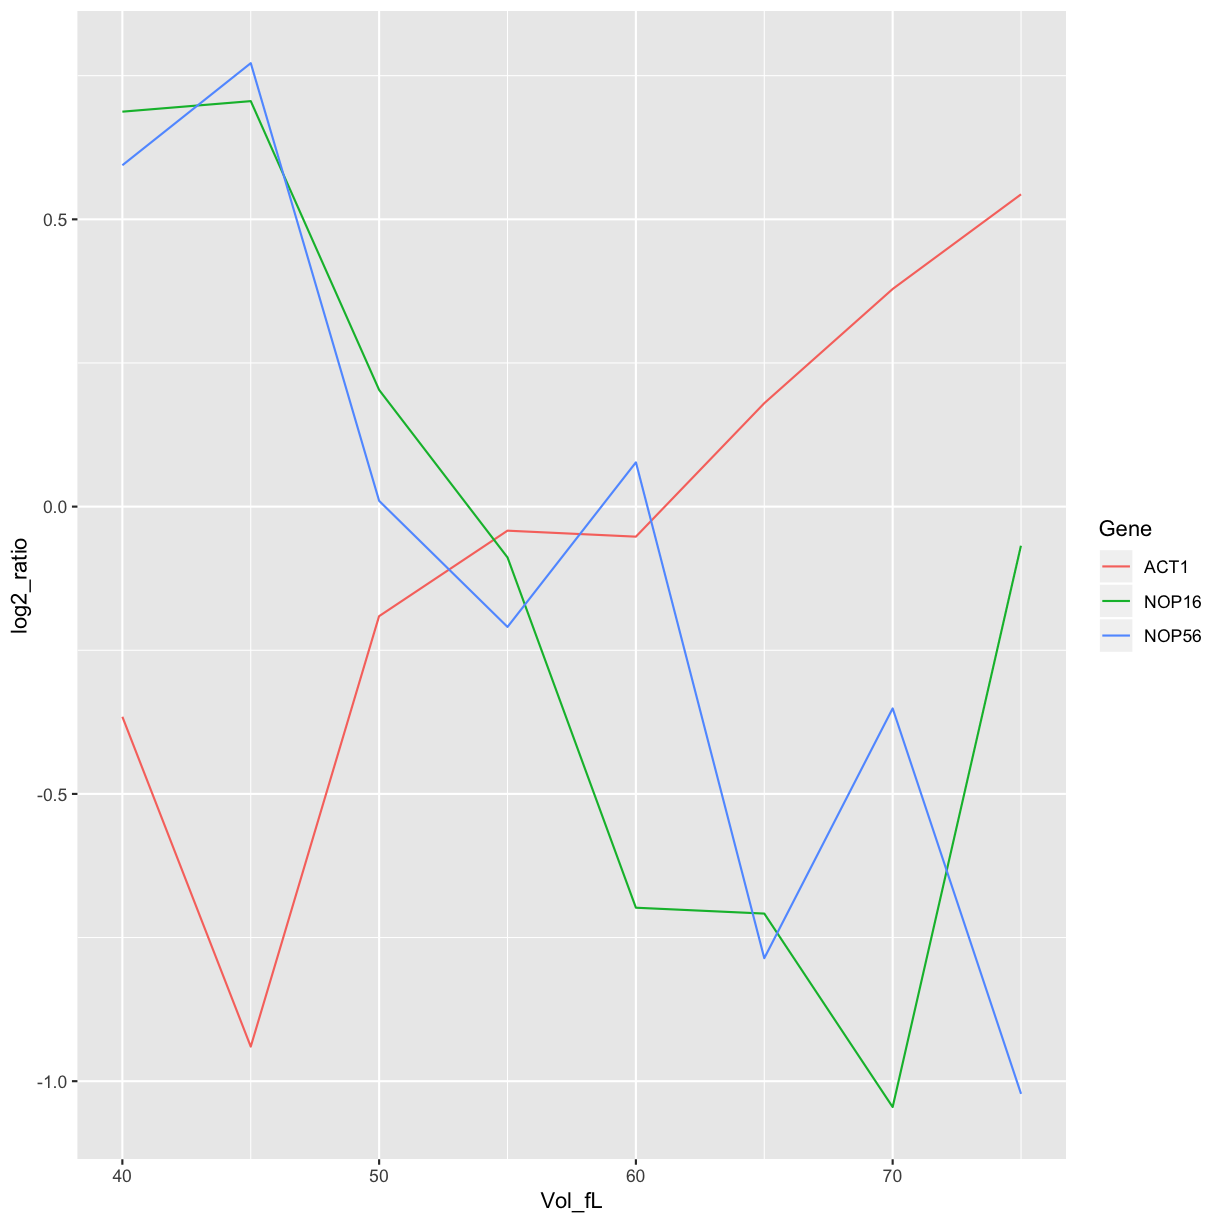
Plot all the favourite genes data
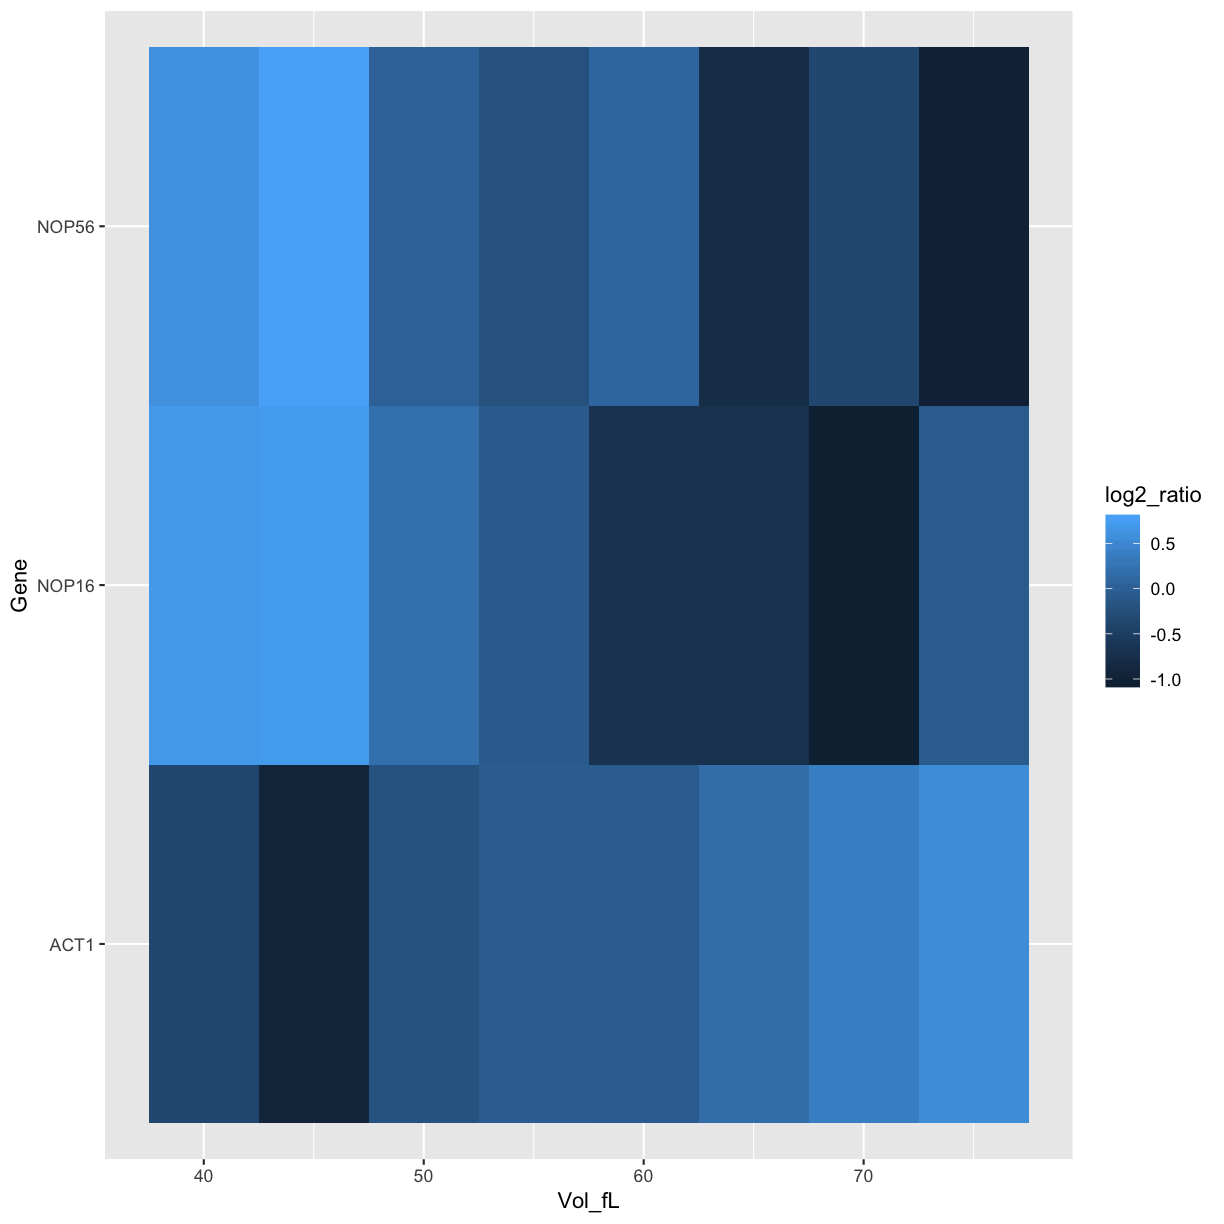
mRNA_data_3genes <- filter(mRNA_data_gathered, Gene %in% c("ACT1","NOP16","NOP56"))

ggplot(data=mRNA_data_3genes, aes(x=Vol_fL,y=log2_ratio,colour=Gene)) +
    geom_line()
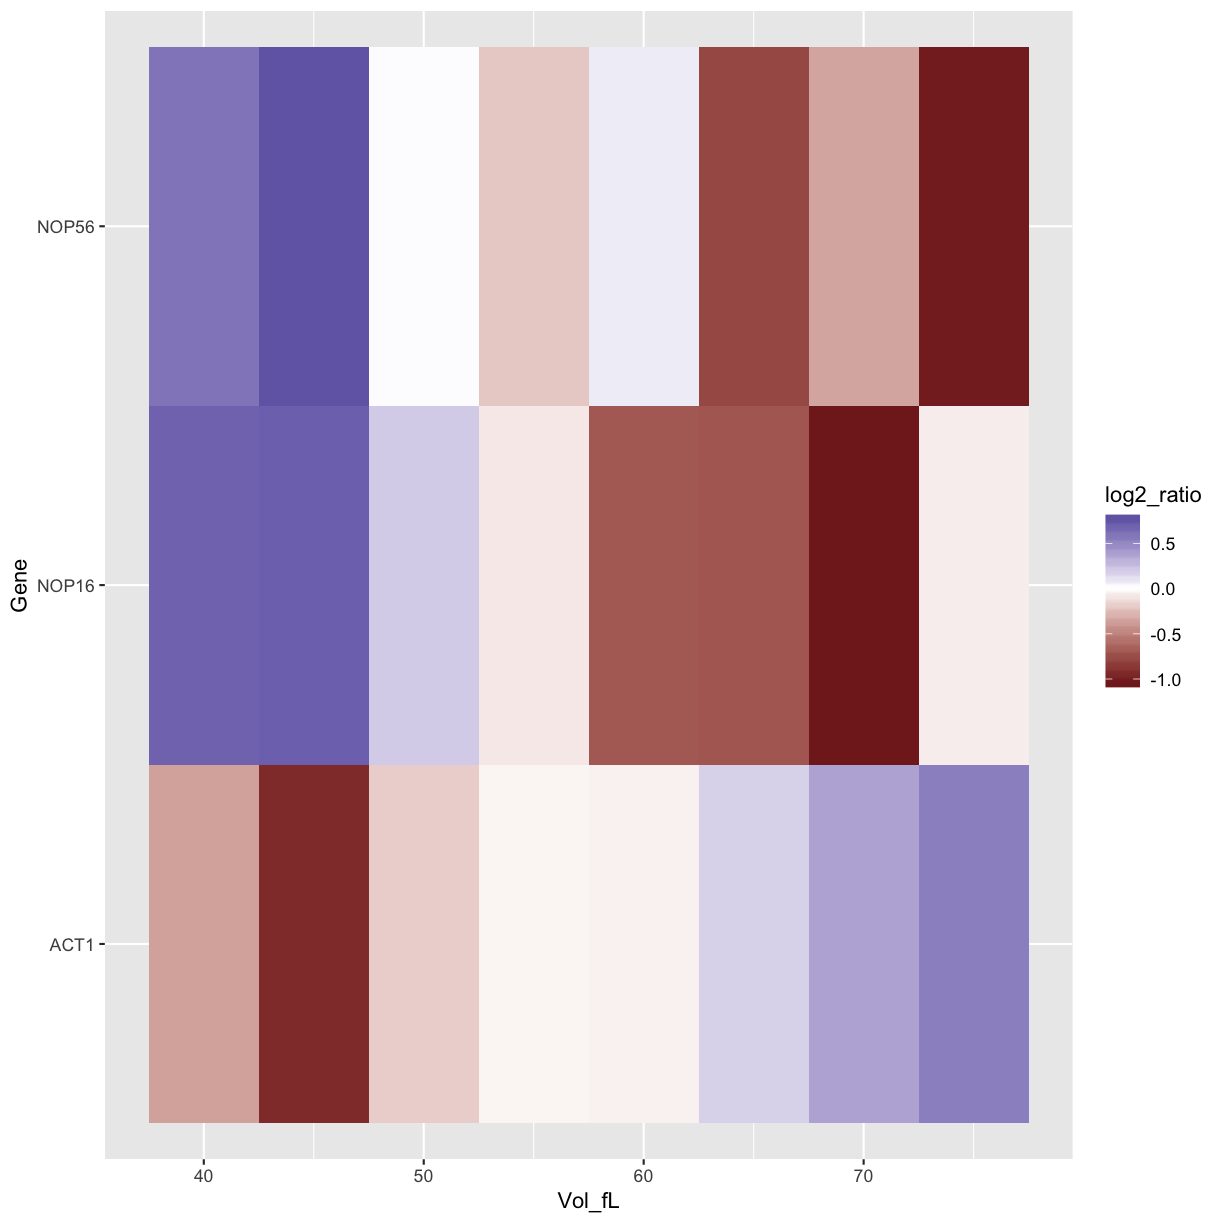
ggplot(data=mRNA_data_3genes, aes(x=Vol_fL,y=Gene,fill=log2_ratio)) +
    geom_tile()
ggplot(data=mRNA_data_3genes, aes(x=Vol_fL,y=Gene,fill=log2_ratio)) +
    geom_tile() +
    scale_fill_gradient2()
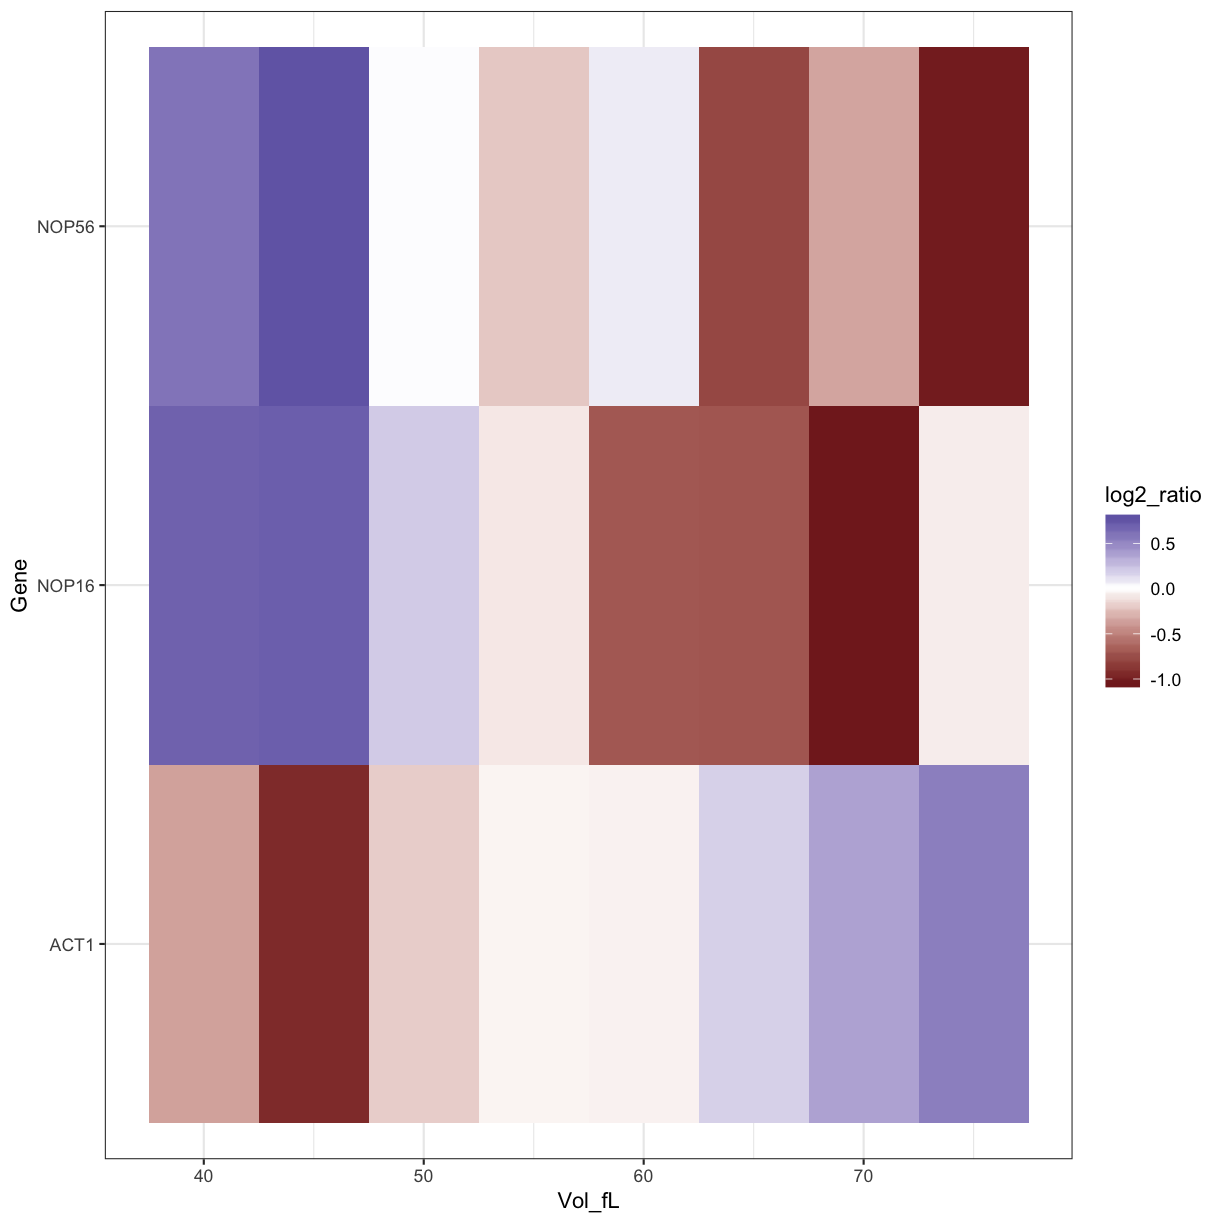
How to make the plot look nice
ggplot(data=mRNA_data_3genes, aes(x=Vol_fL,y=Gene,fill=log2_ratio)) +
    geom_tile() +
    scale_fill_gradient2() +
    theme_bw()
Challenge:
- Plot your other favourite genes. NOP6?
- Can you change the line colours to something nicer?
Solution
mRNA_data_4genes <- filter(mRNA_data_gathered, Gene %in% c("ACT1","NOP16","NOP56","NOP6"))
# ?scale_colour_brewer
Key Points